Thesis Summary
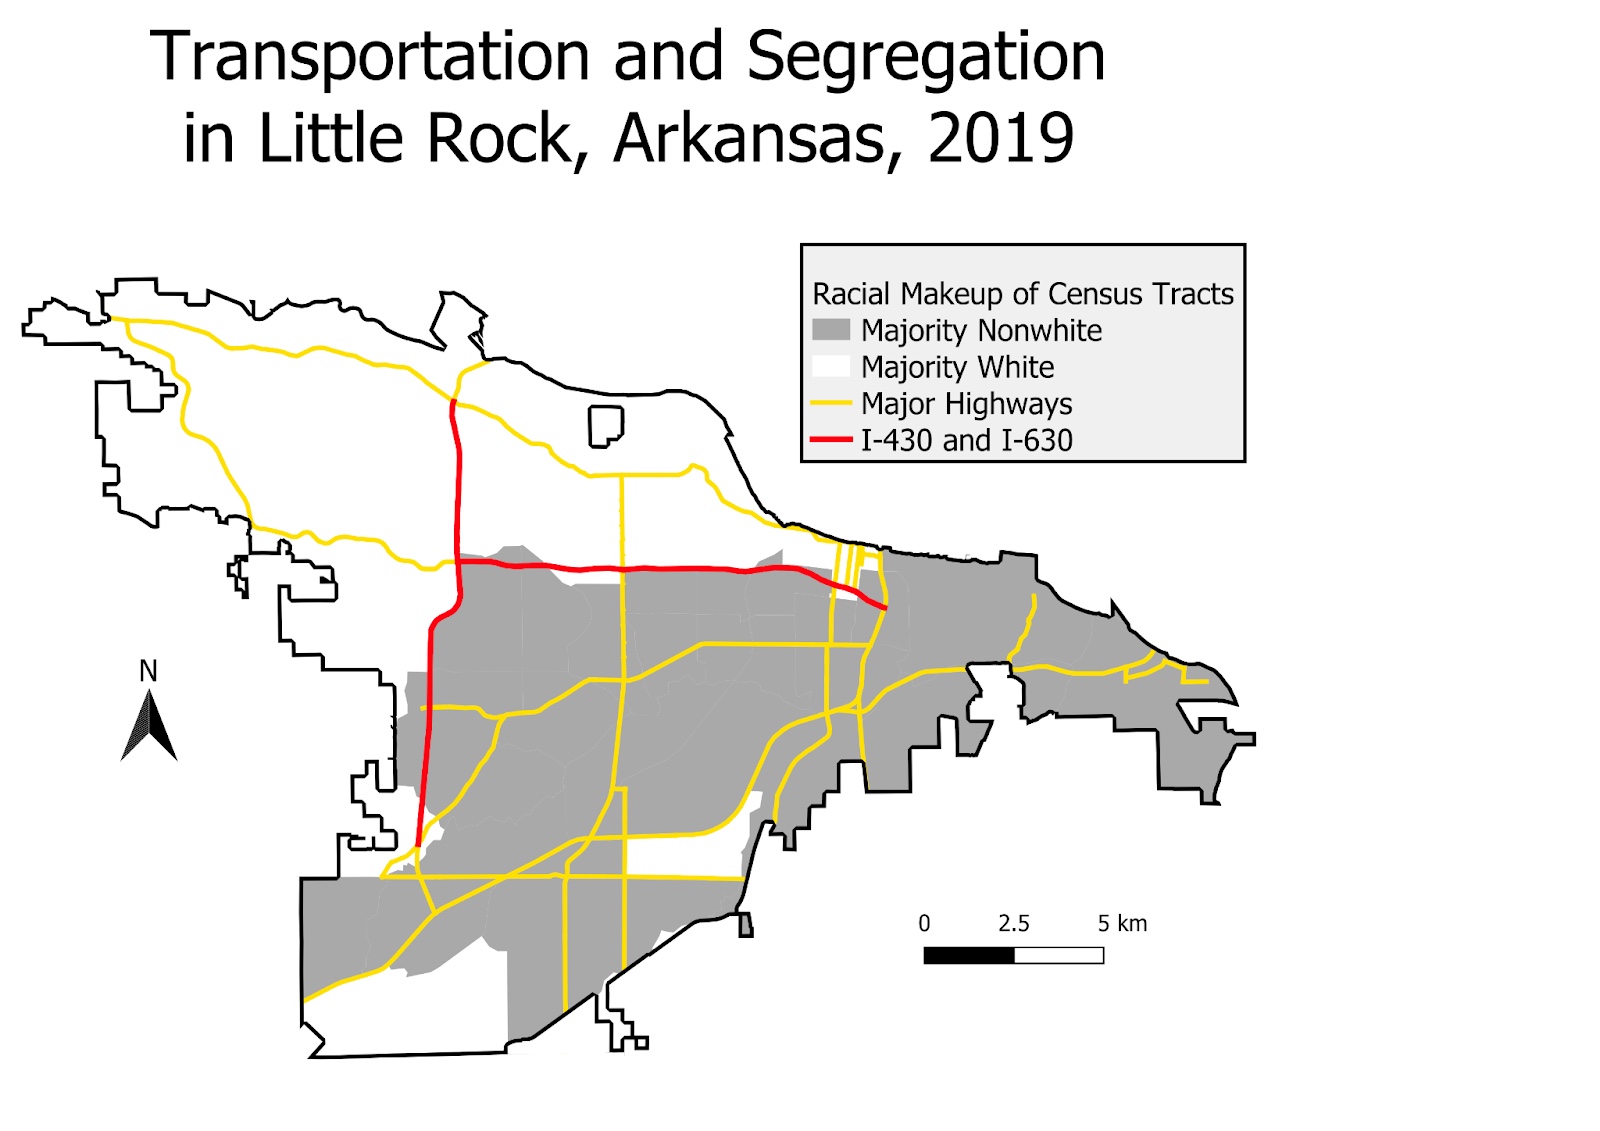
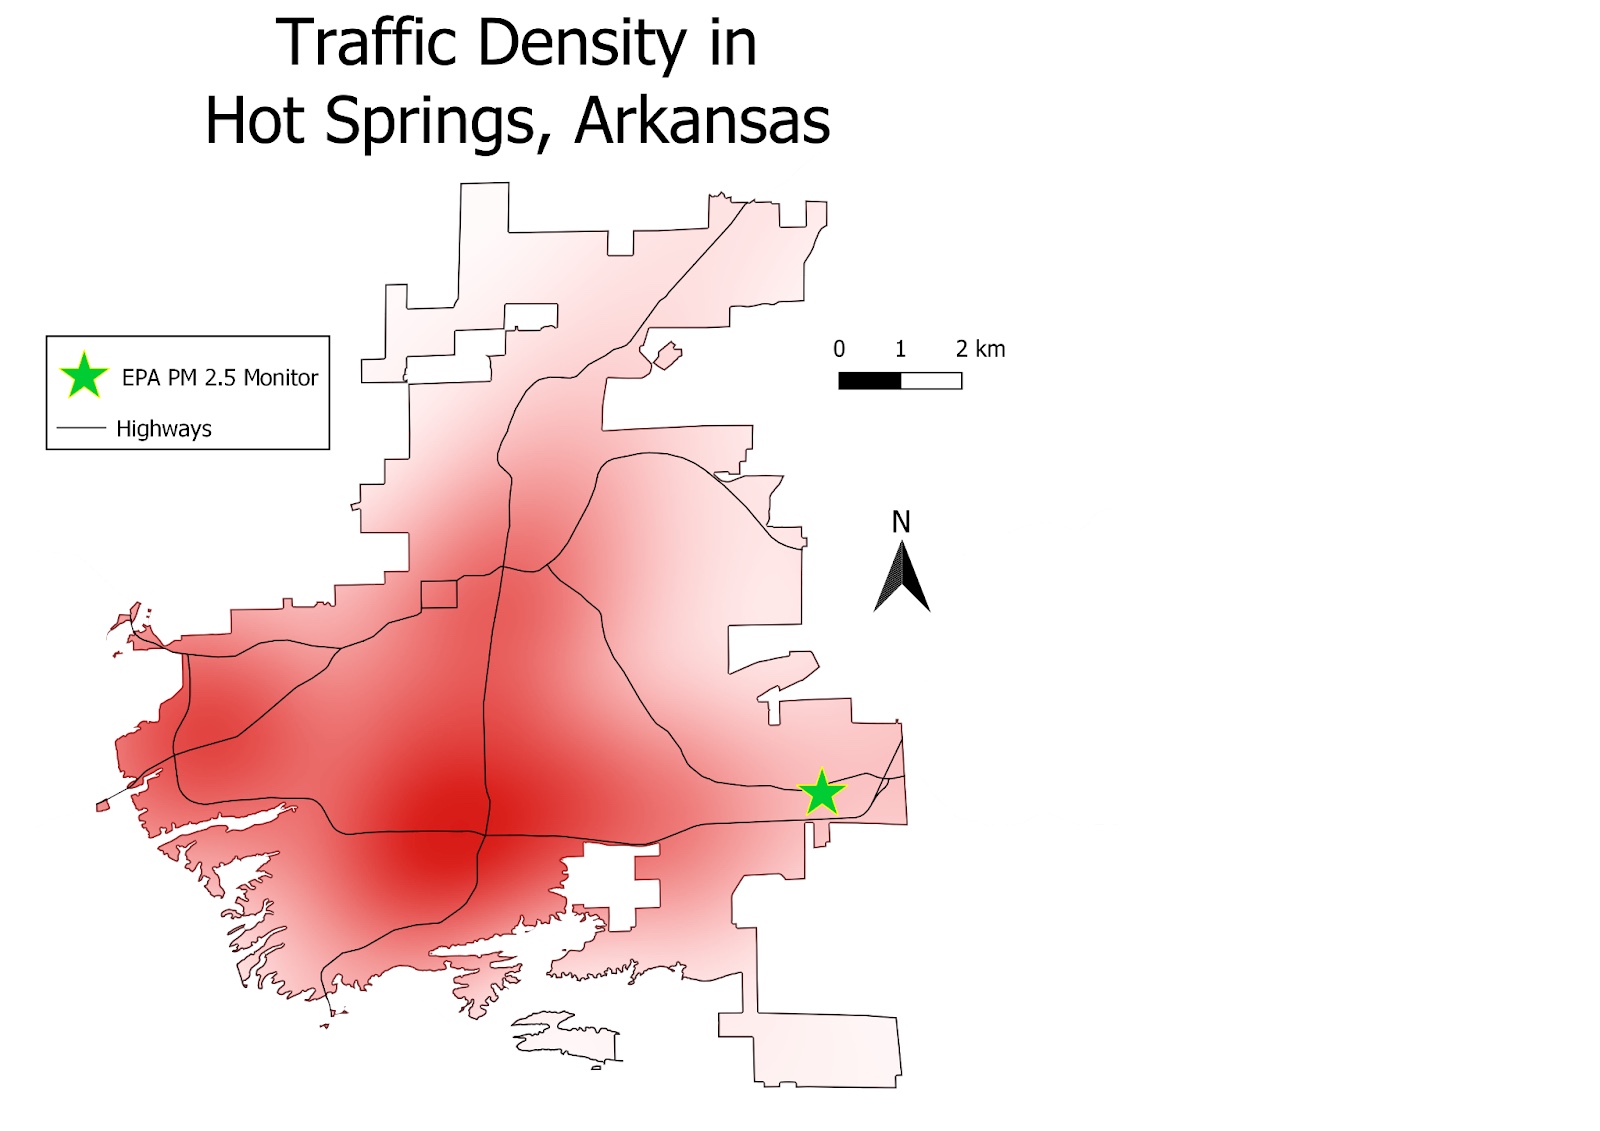
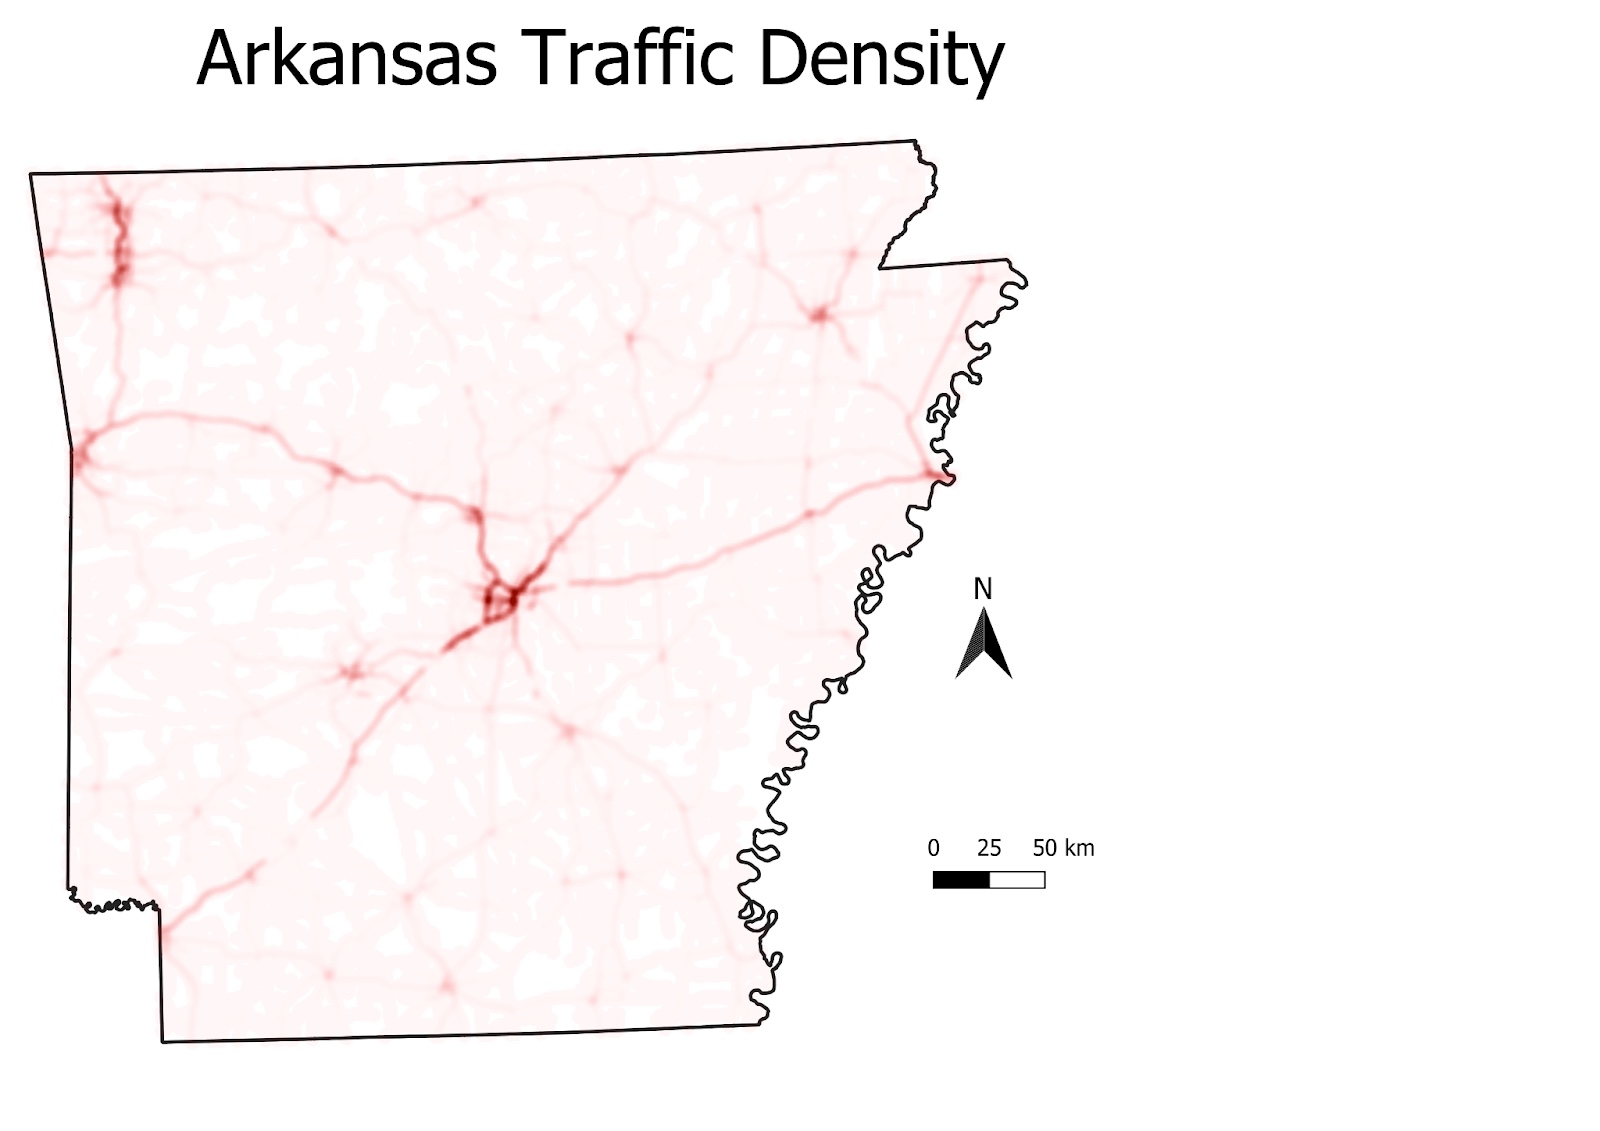
I utilized QGIS to investigate possible links between the distribution of traffic pollution and oppressed communities in the state of Arkansas. Using publicly available traffic data from the Arkansas Department of Transportation, I produced a heatmap modeling a “plume” of automobile pollution across the entire state. Zonal statistics allowed me to compare the distribution and thickness of this “plume” across census tracts, and see if poorer and less white areas were exposed to more traffic pollution on average. Across the board I found significant positive correlations between an area’s level of traffic pollution and that area’s proportion of impoverished and/or nonwhite residents. Furthermore, I suggest that federally mandated monitors responsible for reporting an area’s air quality may be ignoring the most polluted areas of cities, thereby painting an inaccurate picture of how much pollution people are actually exposed.


